Diffusion of Energy and Matter
Transport Properties: Diffusion
Because the molecules in a gas or solution are in constant motion, uneven
distributions of matter and tempeature tend to even out. This is called
diffusion. Normally, we call the transport of matter through random molecular
motion, diffusion. If an unequal temperature distribution is present,
then random molecular motion will redistribute the heat.We call this thermal
conduction.
Fick’s Law:
The amount of a property passing through a unit area per unit
time is called a flux.
e.g. moles m–2s–1. The flux of matter is directly proportional to the gradient
of matter.
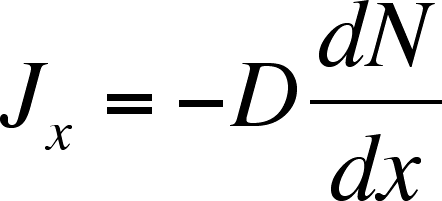
What does this mean? Mathematically,
 Equation 1
where D is the diffusion coefficient, the proportionality constant
and dN/dx is the gradient of matter, or how the amount of matter
varies as a function of position. For simple molecules in aqueous
solution, D is on the order of 10-5 cm2 s–1.
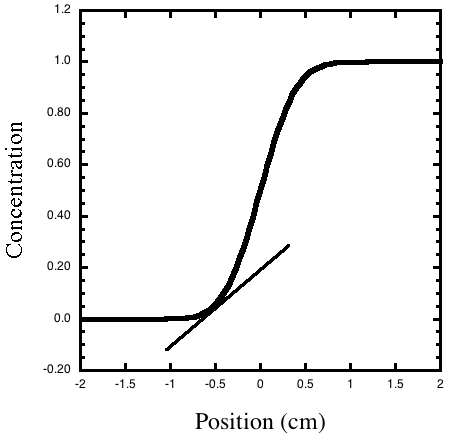
Figure 1. The concentration gradient is how fast the
concentration changes at each position, or the slope of the line tangent
to the concentration
cure. The slope of the line drawn tangent to the curve at x = –0.5
is the gradient of the concentration at that position.
The Diffusion Equation describes how the concentration at position x changes
as a function of time.
 Equation
2
The equation says that the rate of change of the concentration of the ith chemical
species at position x is the diffusion coefficient, D (cm2 s–1),
that is multiplied times the rate of change of the gradient of the concentration
at the position. (This second derivative with respect to position is called
the one-dimensional Laplacian and is a measure of how sharply the concentration
changes with position.)
We can look at some solutions to this equation that describe simple diffusion.
Let’s assume we have a tube in which a solute is present in half of the
container. The concentration is taken initially as 1. The concentration profile
at any time can be computed by:
 Equation 3
where D is the diffusion coefficient, with units of cm2 s–1.
Notice how slow is diffusion. After 10,000 seconds, the edge of the concentration
profile has only advanced 0.5 cm.
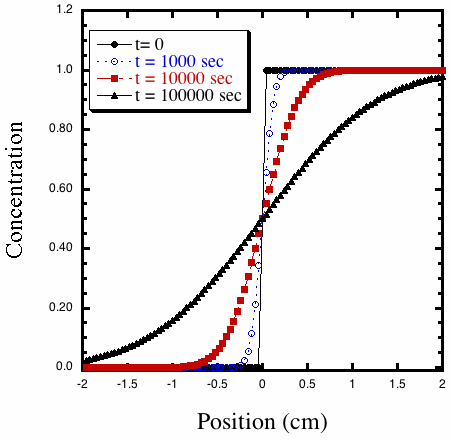
Figure 2. Calculated concentration profiles from the solution to
the diffusion equation with D = 10–6 cm2 s–1 at
different times.
Experimental example
A pH indicator, bromophenol blue, is shown diffusing into an agar gel over a 24 hours period. The scale is in cm.
The movie illustrates 24 hours of diffusion of the pH indicator bromophenol
blue in an agar gel. Notice again how slow the dye diffuses into the gel.
Even with this simple setup, it is possible to extract the diffusion coefficient.
Figure 3 shows a curve fit to the grey level vs position for an image after
12 hours. ImageJ is a free Java
program that allows quantitative data analysis include plotting grey level
versus position along a selected line.
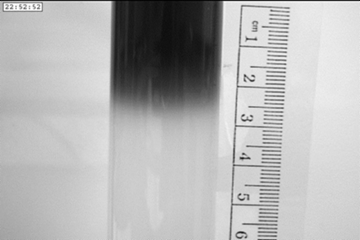
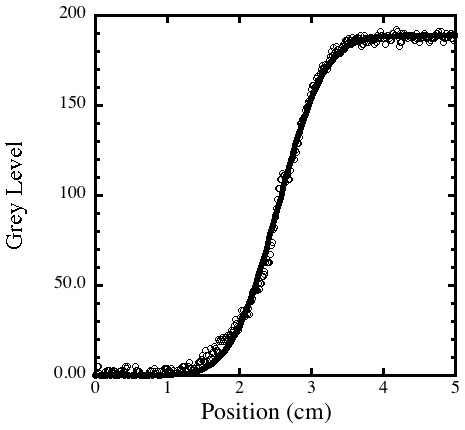
Figure 3. A grey scale image that was imported into ImageJ. Curve
fit for the grey level along the vertical axis of the tube using Equ. 3,
after 12 hours. From the curve fit we can calculate a diffusion coefficient
of
3
x 10–6 cm2 s–1,
a reasonable value for a large organic molecule in water.
Thermal Transport
If we are interested in how a temperature gradient relaxes, i.e., how "heat"diffuses, we can use the same mathematics but substituting T for C:

Instead of a diffusion coefficient,D, we have the thermal diffusivity, k. The units are the same as for the diffusion coefficient, cm2 s–1.
Thermal diffusion is also a slow process but in liquids it is faster than diffusion with typical value of k on the order of 10–3 cm2 s–1.
Convection
We will discuss in more detail in the next module but let's see how much faster the dye will spread through the water if gel is not present.
Left: Diffusion in a gel in a cuvette (30 minutes per frame). Right: Dye added to water
without gel (1 frame per second)
Liesegang Rings
Liesegang Rings are periodic patterns that arise spontaneously in the counter-current diffusion of two salts that can form an insoluble precipitate. For example, imagine if lead nitrate, Pb(NO3)2, is dissolved in water containing agar, is poured in a test tube and allowed to set. Then an agar-containing solution of potassium iodide, KI, is poured on topof the lead nitrate gel. The potassium and iodide ions will diffuse in the bottom gel while lead ions and nitrate ions will diffuse up. (The gel is used to prevent convection.) When lead and iodide ions meet, they form lead iodide, PbI2an insoluble precipitate.Rings appear at greater and greater distances. Using time-lapse video we can measure the position of each new ring and the time at which it appeared. We then calculate the distance (in cm) of the ring from the interface of the two gels and call it x. By plotting x2 versus time in second we can obtain a straight line whose slope is the diffusion coefficient.
Figure 4. Left: Time lapsed movie of Liesigang rings -- total time was 11 hours. Right: Same movie but with contrast enhanced using ImageJ
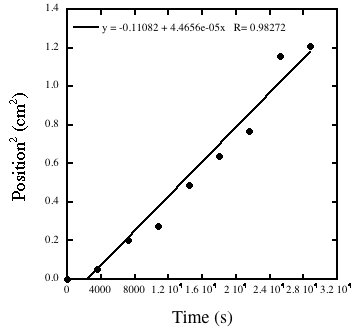
Figure 5. A plot of the square of the position of a ring versus the time at which it appeared. A linear regression gives an estimate for the diffusion coefficient of 4 x 10⁻⁵ cm2 s–1, a reasonable value for an ionic compound in water.
For a pdf of the lab procedure, click here.
Diffusion in Weightlessness
We can see clearly how slow diffusion is compared to convection by looking at videos of simple experiments performed on parabolic flights on the KC-135 and on the International Space Station.
Glycerine and water on the KC-135 aircraft
It is impossible to see diffusion on the KC-135 for most fluids because of the short period of weightlessness afforded by the parabolic flight path (20 seconds). Nonetheless, we can see the dramitic difference in behavior for fluids with significant differences in density, even when the viscosity of one fluid is large. (Glycerine is about 1000 times more viscous than water.)
Left: Glycerine (with a dye) is injected into water in a 2.2 cm diameter test tube. The injection is performed during the 20 second period of weightlessness. The glycerine is 20% more dense than water and so it rapidly sinks when the 1.8 g pullout begins.
Right: Dyed water is injected into glycerine in a 2.2 cm diameter test tube. The injection is performed during the 20 second period of weightlessness. The water is 20% less dense than glycerine and so it rapidly rises when the 1.8 g pullout begins.
Honey and water on the International Space Station
A zero-upmass experiment was performed on the International Space Station, called Miscible Fluids in Microgravity (MFMG). The Miscible Fluid in Microgravity (MFMG) experiment tested how miscible fluids, that is, fluids that completely dissolve in each other, interact without the interference of gravity. The experiments involved injecting honey into water or water into honey inside surplus syringes. It isdramatically evident that without convection, the process of diffusion is very slow. If you try this experiment on earth, the honey, which is much more dense, quickly settles to the bottom of a container of water. Likewise, it is not possible to create a blob of water in honey on earth because it quickly floats to the top.
Time lapse movie of pure honey being injected into pure water. Total time is 10 minutes.
Time lapse movie of dyed water being injected into 80:20 honey:water. Total time is 10 minutes.
Time lapse movie of dyed water being injected into pure honey. Total time is 10 minutes.
Movie of honey being poured into water under 1 g in real time.
References and Further Reading
Crank, J. Mathematics of Diffusion; Clarendon: Oxford, 1975.
Cussler, E. L. Diffusion: Mass Transfer in Fluid Systems; Cambridge:
London, 1997.
Einstein, A. Investigations on the Theory of the Brownian Movement;
Dover: ISBN:
0486603040
Sharbaugh III, A. H.; Sharbaugh Jr., A. H. "An Experimental Study
of the Liesegang Phenomenon and Crystal Growth in Silica Gels,"J.
Chem. Ed. 1989, 66, 589-594.
Epstein, I. R.; Pojman, J. A. An Introduction to Nonlinear Chemical Dynamics: Oscillations, Waves, Patterns and Chaos; Oxford University Press: New York, 1998.
Jones, D. E. H., Walter, Ulrich "The Silicate Garden Reaction in Microgravity: A Fluid Interfacial Instability,"Journal of Colloid and Interface Science.1998, 203, 286.